Prophet Model
Note: The Prophet Algorithm is not a Neural Network. It is build to act as a benchmark to understand how the Neural Networks perform.

Introduction
Facebook Prophet is an open-source algorithm for working with time series data. Prophet is a procedure for forecasting time series data based on an additive model where non-linear trends are fit with yearly, weekly, and daily seasonality, plus holiday effects.
It works best with time series that have strong seasonal effects and several seasons of historical data. Prophet is robust to missing data and shifts in the trend, and typically handles outliers well.
To understand the Math behind Prophet click here
Data Preparation
#Load data and library
data = read.csv("data.csv")[,3]
date = read.csv("data.csv")[,1]
date = as.Date(date, format = "%d/%m/%Y")

library(ggplot2); library(forecast); library(prophet)

# Train and Test Dataset
train = ts(data[1:236], start = c(2001,1), frequency = 12)
test = as.numeric(tail(data, 12))
We will use the first 236 values to train the model and the remaining 12 will be used to test forecasting power of Prophet for this dataset.
Prophet requires that the dates (in proper Date format) are located in a column named “ds” and values of the series in a column titled “y”.
df = data.frame(ds = date[1:236], y = data[1:236])
m = prophet(df)
future = make_future_dataframe(m, periods = 12, freq = 'month')- The object m contains the Prophet model fitted on the df data frame.
- The object future contains the prediction dates i.e. from Sept-2020 to Aug-2021.
- The argument frequency = ‘month’ tells we need monthly predictions. The default is daily.
- The argument periods = 12 implies 12 values to be forecasted.
Prediction
forecast = predict(m, future)
plot(m, forecast) 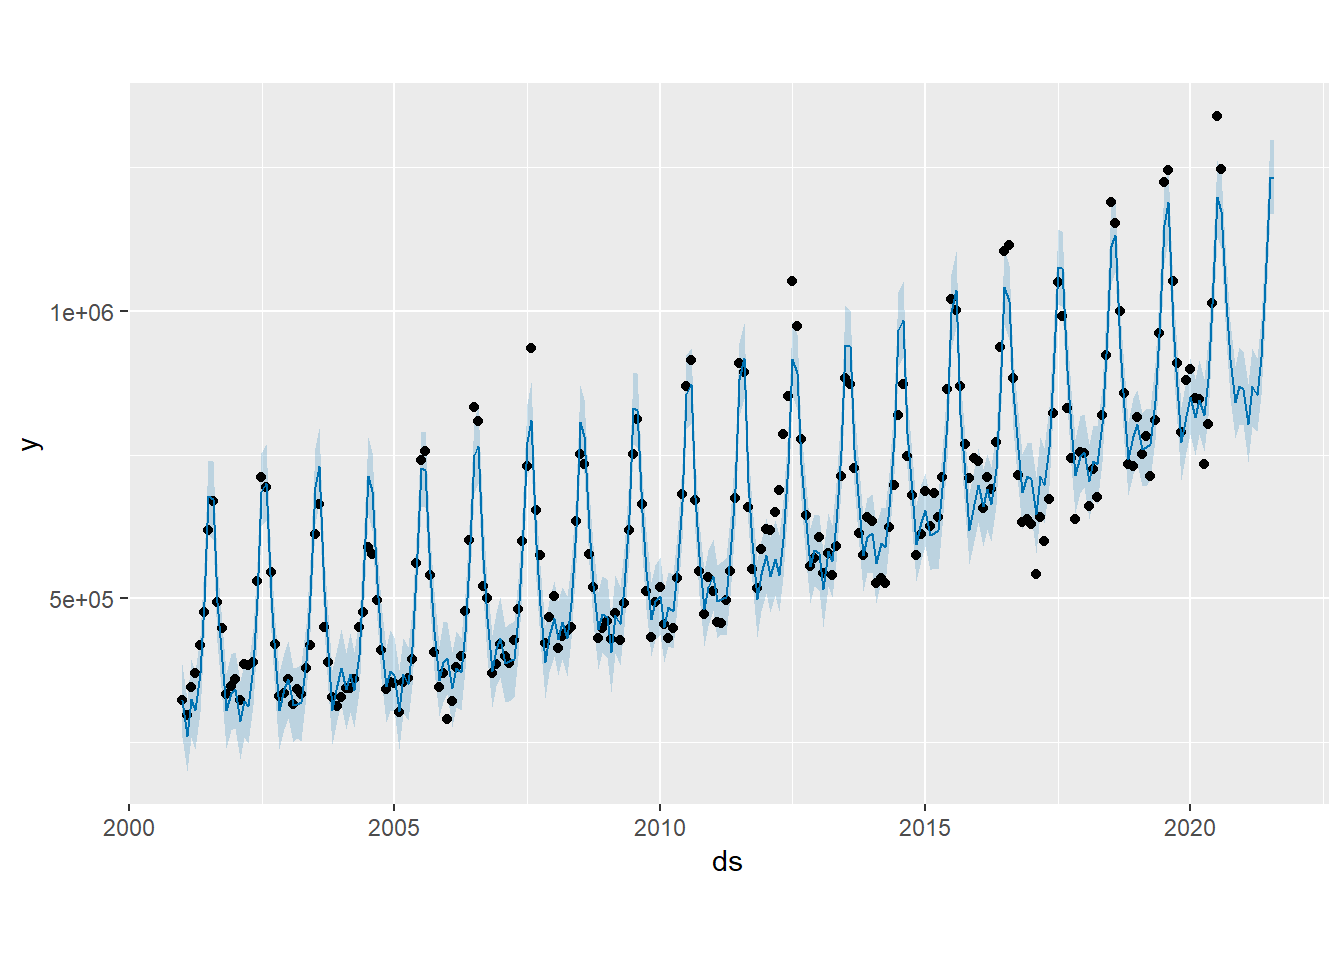
- Black dots are Actual data points.
- Blue line are Predicted values as per the Prophet model.
- Light Blue shaded regions are the Confidence Intervals.
- The forecast seems to be capture the trend and seasonality quite well.
prophet_plot_components(m, forecast)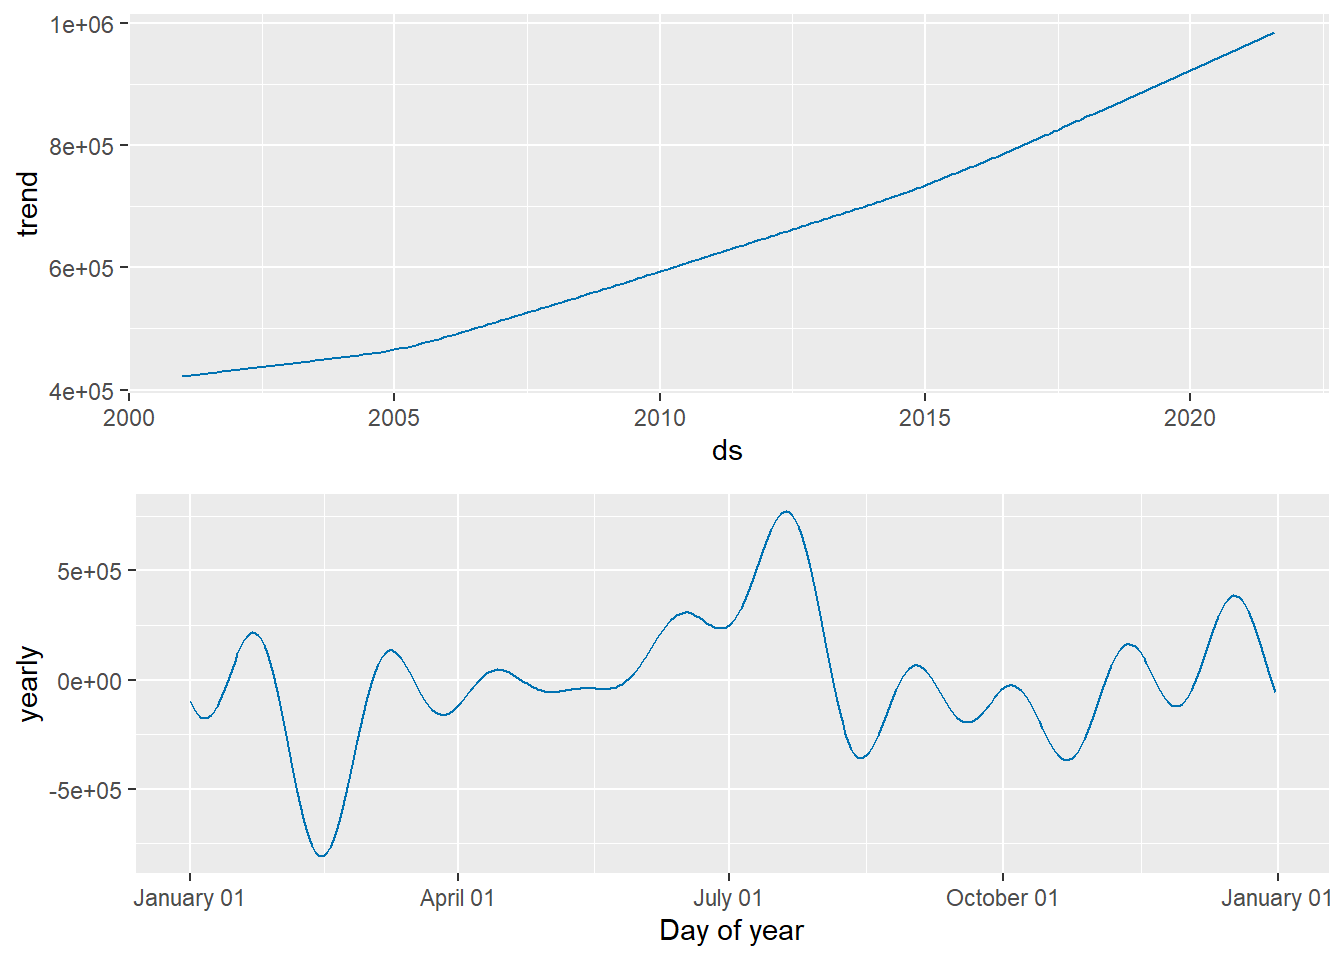
- In our case, there is no weakly or daily seasonality.
- So, the prophet_plot_components gives us only the trend and annual seasonal trend.
- Under Data Exploration, we saw the peak in consumption during the months of June-Aug and fall in Feb and Nov which is reflected here as well.
Data Frame Creation for plots and table
- forecast$yhat includes the Predicted values
- forecast$yhat_upper includes the Upper 95% Confidence Intervals
- forecast$yhat_lower includes the Lower 95% Confidence Intervals
pred = tail(forecast$yhat, 12)
upper = tail(forecast$yhat_upper, 12)
lower = tail(forecast$yhat_lower, 12)

result = cbind(as.character(tail(date,12)), # Dates
               as.numeric(round(test,2)),   # Actual
               as.numeric(lower),           # Lower CI
               as.numeric(round(pred,2)),   # Prediction
               as.numeric(upper))           # Upper CI
Plot

- Here, we have a plot of the Actual and Predicted values for the last 12 months till Aug, 2021.
- The black represents Actual and Red the Prophet-predicted values.
- The yellow band is the 95% Confidence Interval.
- A few observed values lie outside the Confidence Interval Band. This is bad news because it means that the model could not predict them properly.
- However, we can see a few observed and predicted values are very close.
RMSE-MAPE
library(Metrics)
round(c(rmse(result$actual, result$pred),
        mape(result$actual, result$pred)) ,5)
## [1] 78693.33947 0.07425- RMSE of 78,693.34 implies that we are 95% confident that the Actual Value lies between (prediction +/- 154,238.95).
- For e.g. Aug 2021 Actual Value (1 223 327.98) must lie in the interval of (1 076 343.8, 1 384 821.8). This point lies inside the yellow band.
- MAPE of 0.07425 implies that we are, on average, about 7.4% away from the actual value.
Output Table
| U.S. Consumption of Electricity Generated by Natural Gas | ||
|---|---|---|
| Date | Actual1 | Predicted1 |
| Sep 1, 2020 | 1,006,071.14 | 1,015,378.18 |
| Oct 1, 2020 | 924,056.16 | 916,235.46 |
| Nov 1, 2020 | 737,935.17 | 841,314.31 |
| Dec 1, 2020 | 839,912.60 | 868,872.25 |
| Jan 1, 2021 | 833,783.30 | 864,478.30 |
| Feb 1, 2021 | 759,358.16 | 803,540.79 |
| Mar 1, 2021 | 715,165.06 | 869,791.23 |
| Apr 1, 2021 | 724,125.84 | 854,196.11 |
| May 1, 2021 | 787,027.16 | 920,158.92 |
| Jun 1, 2021 | 1,051,774.78 | 1,046,561.33 |
| Jul 1, 2021 | 1,199,673.32 | 1,233,024.69 |
| Aug 1, 2021 | 1,223,327.98 | 1,230,582.84 |
| Source: US Energy Information Adminstration | ||
|
1
Thousand Mcf
|
||