Conclusion
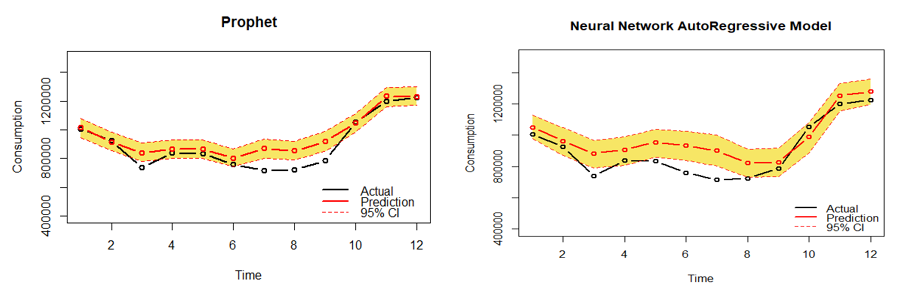
We used Facebook Prophet Algorithm to have a benchmark which the Neural Networks had to surpass.
From an analytical perspective, RMSE tracks variability and MAPE tracks the bias in our model. Ideally, we want low values for both. Thus, we select the model with the smallest values for both RMSE and MAPE figures.
RMSE - MAPE Figures
| Accuracy Measures for Different Networks | ||
|---|---|---|
| Name | RMSE | MAPE |
| Prophet | 78693.33 | 0.07425 |
| NNAR | 103600.35 | 0.11076 |
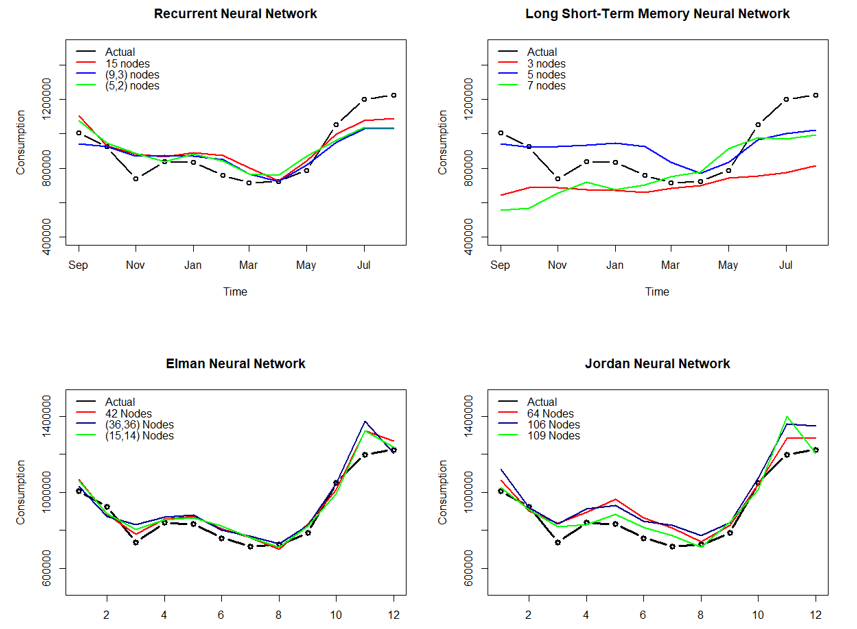
| RNN (15 nodes) | 110787.3 | 0.10165 |
| RNN (9,3 nodes) | 113579.5 | 0.09676 |
| RNN (5,2 nodes) | 121377 | 0.10425 |
| LSTM (3 nodes) | 239540.9 | 0.19173 |
| LSTM (5 nodes) | 128035.8 | 0.12508 |
| LSTM (7 nodes) | 205560.8 | 0.17331 |
| Elman (42 nodes) | 54236.37 | 0.05251 |
| Elman (36,36 nodes) | 65440.62 | 0.05382 |
| Elman (15,14 nodes) | 55922.01 | 0.05241 |
| Jordan (64 nodes) | 74657.98 | 0.07592 |
| Jordan (106 nodes) | 93776.59 | 0.09367 |
| Jordan (109 nodes) | 71608.58 | 0.05725 |
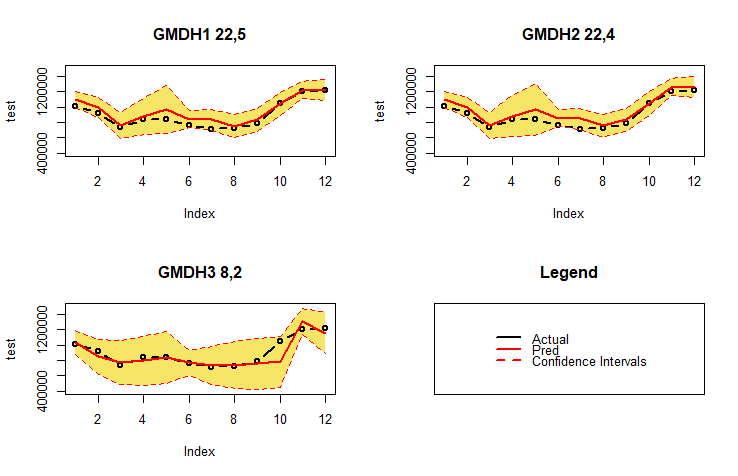
| GMDH(22 inputs,5 layers) | 71444.48 | 0.06892 |
| GMDH(22 inputs,4 layers) | 77453.65 | 0.078 |
| GMDH(8 inputs,2 layers) | 91328.53 | 0.06016 |
The Facebook Prophet Algorithm has a MAPE of 7.4% and RMSE of 78,693.33 which is pretty decent.
Clearly, the ELMAN Neural Networks have the best performance for our U.S. Electricity Consumption Time Series.
Among the 3 Elman Models, we can pick the one with 42 nodes as the best fit, with RMSE = 54,236.37 and MAPE = 0.05251.
A MAPE of 0.05251 implies that on average we are 5.25% away from actual value. It does not specify direction (+/-).
A RMSE of 54,236.37 and Aug 2021 prediction of 12,69,665.6 implies that we are 95% Confident of observing the actual value between (11,63,362.315 and 13,75,968.885) given by \([1269665.6 +/- 1.96*54236.37]\).
The Actual value for Aug 2021 is 12,23,327.977 which lies inside the interval above.
Plot of All Models
It is well known that traditional methods of time series analysis have many drawbacks like inability to deal with missing values, inability to properly capture complex dynamics of the data and so on.
The use of Deep Learning for Time series forecasting overcomes these problems. Neural Networks are able to learn the complex underlying seasonal and trend dynamics well and produce reliable forecasts.
All models are Wrong, but some are Useful!